
Journal Quality Report on "Nano TransMed"
Recently, the 5GH Team analyzed the Research Articles published on the journal "Nano TransMed", and found 20% (4 of 20) of them has problematic data/spectra.
Seventy-seven articles, including Review Articles, Research Articles, Editorials, Book Reviews, Highlights, and Technical Notes, have been published on the journal since 2022, when the journal was launched.But only the Research Articles were included in the analysis by the 5GH Team. Until now (April 21st, 2025), 20 Research Articles were published on the journal. Among them, four Research Articles were found to have problematic data/spectra. Although the number is small, the proportion is as large as 20%, suggesting the review and editorial process of the journal did not maintain high standards.
10.1016/j.ntm.2024.100049
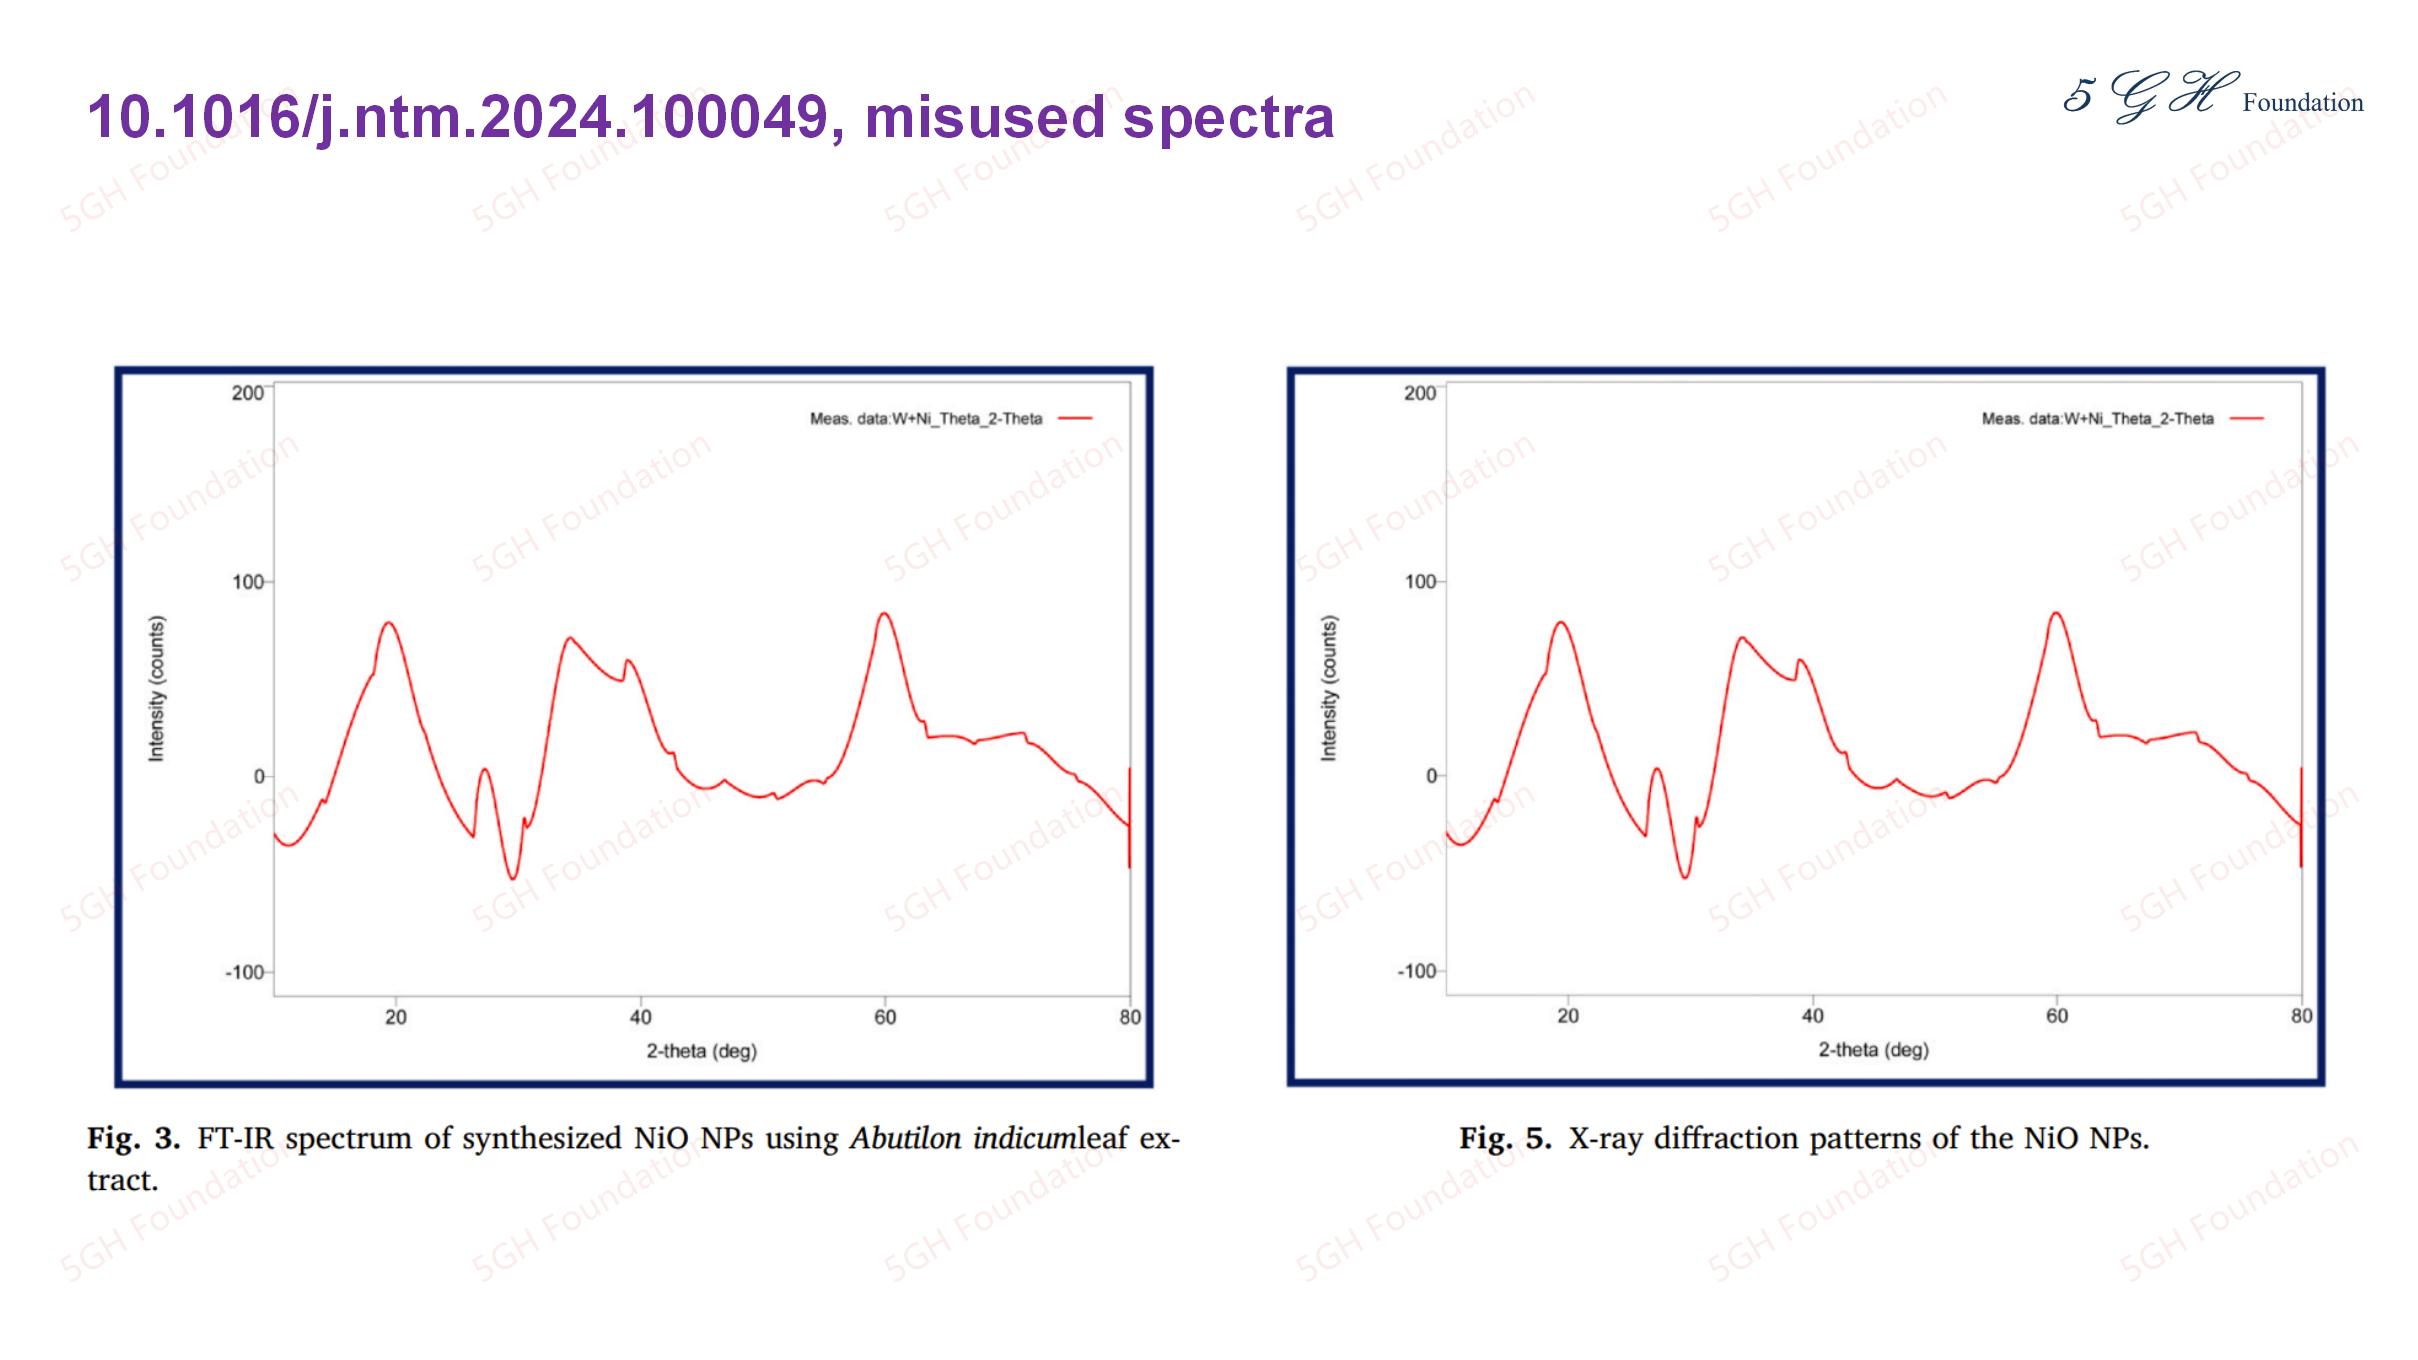
Although the Figure 3 and Figure 5 were described as FT-IR spectrum and X-ray diffraction pattern, respectively, for the NiO nano-particles, the lines in these figures are the same, suggesting the authors may misuse the spectra in one or both of these two figure.
This article has other issues, such as that the SEM images in Figure 7 and Figure 8 do not have the scale bars.
10.1016/j.ntm.2024.100052
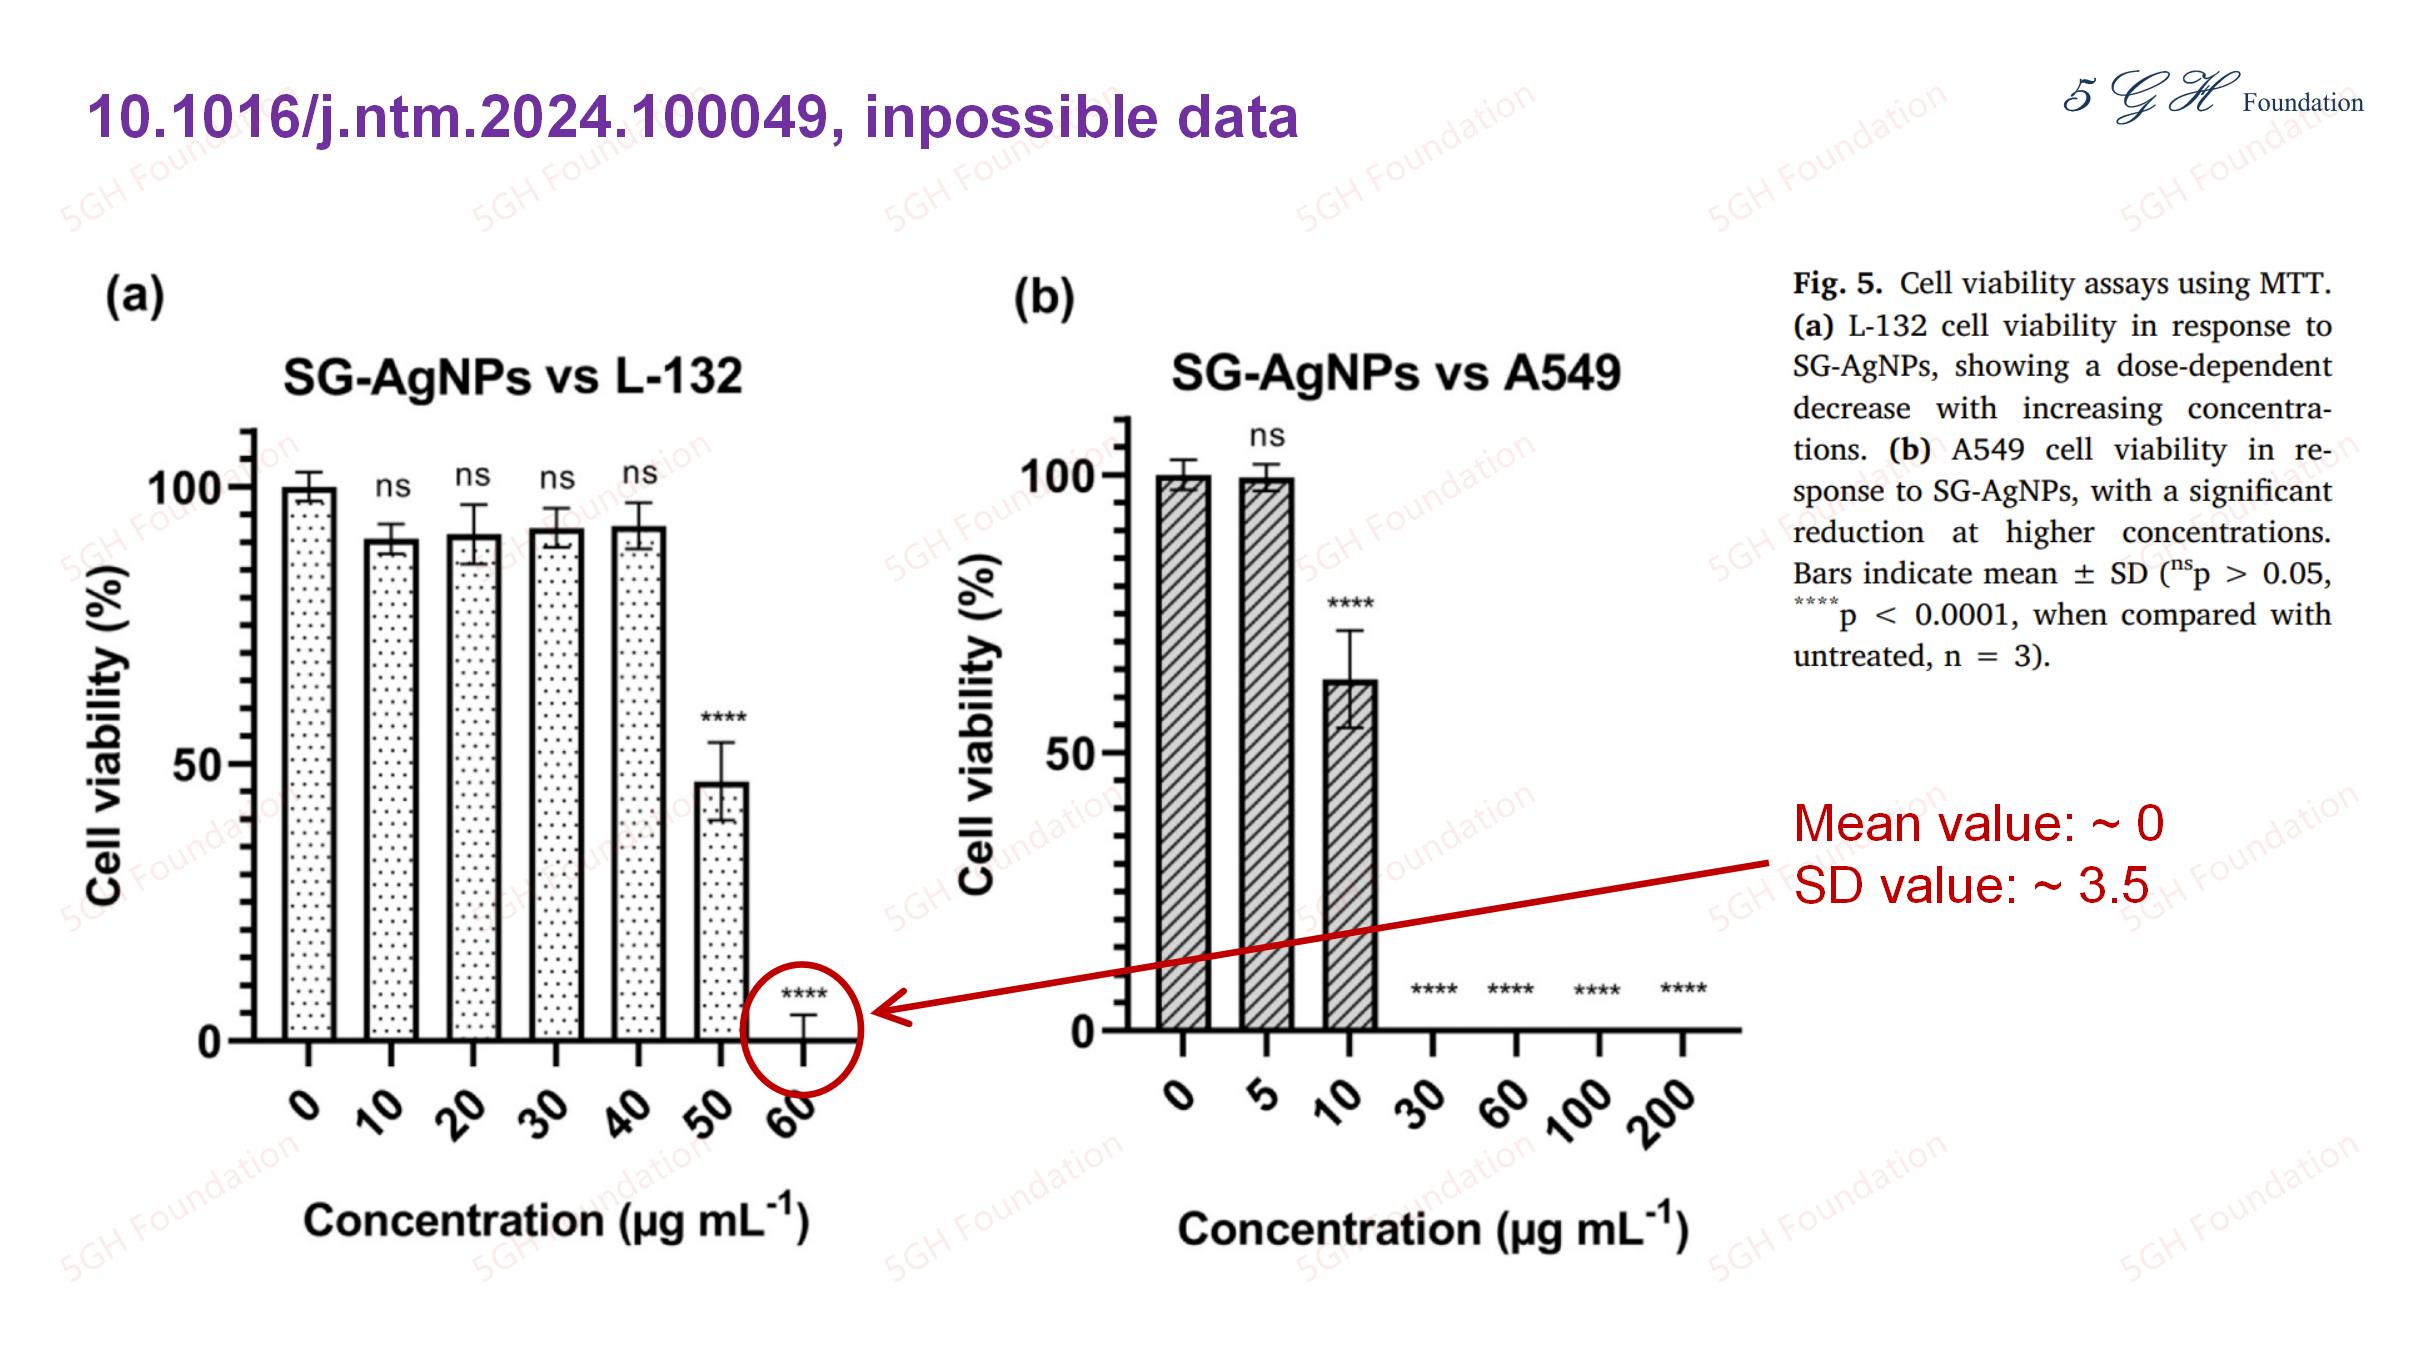
In figure 5(a), the bar for 60 μgmL-1 has mean value of about 0 (less than 1), and standard deviation of about 3.5 (read using automeris APP, https://automeris.io), and these data is impossible. Since the Cell Viability is always be non-negative, we assume the three reads (x1, x2, and x3) for the 60 μgmL-1 are: x1=m-a, x2=m-b, x3=m+a+b, where m is the mean value (m>0), 0<=a,b<=m. Therefore the standard deviation (SD): SD={[a2+b2+(a+b)2]/2}1/2. Because a2+b2<(a+b)2, therefore, SD<a+b. When a=b=m SD reaches its maximum SDmax=2m, that means when the sample size is 3, the mean value is no less than half of the SD, suggesting that the data on for the 60 μgmL-1 is impossible.
10.1016/j.ntm.2024.100034
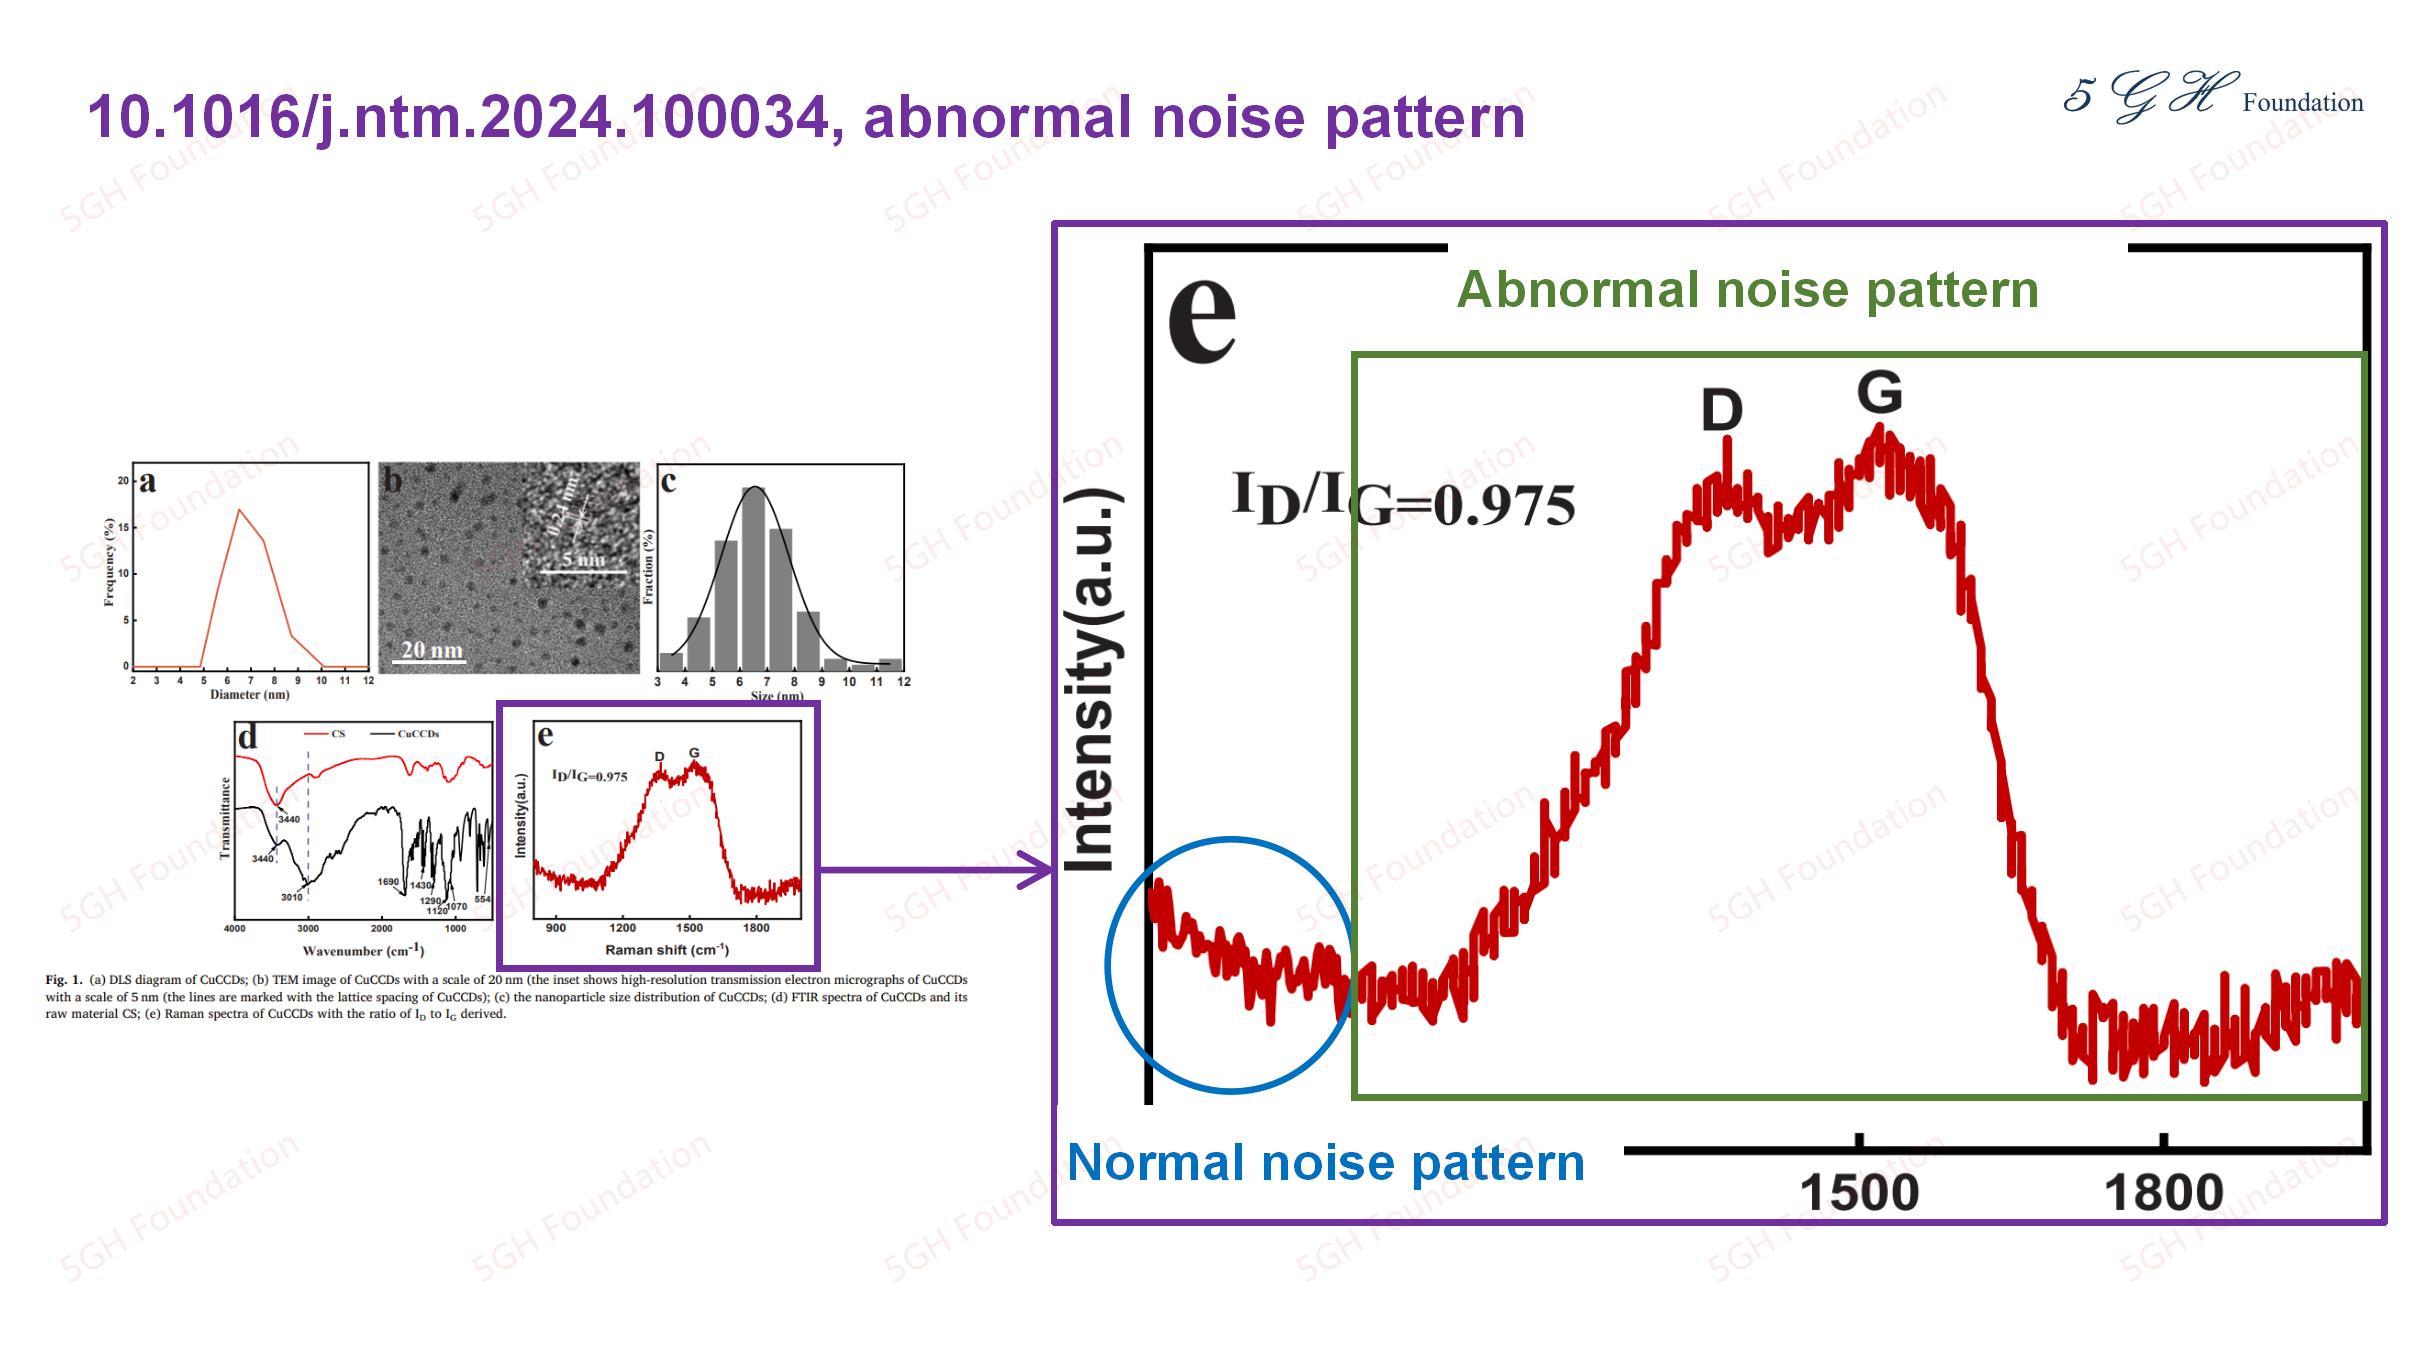
Abnormal noise pattern is observed in the Reman spectra, Figure 1(e). Most part of this Raman spectra (shown in green rectangle) consists large number of vertical lines.
10.1016/j.ntm.2024.100035
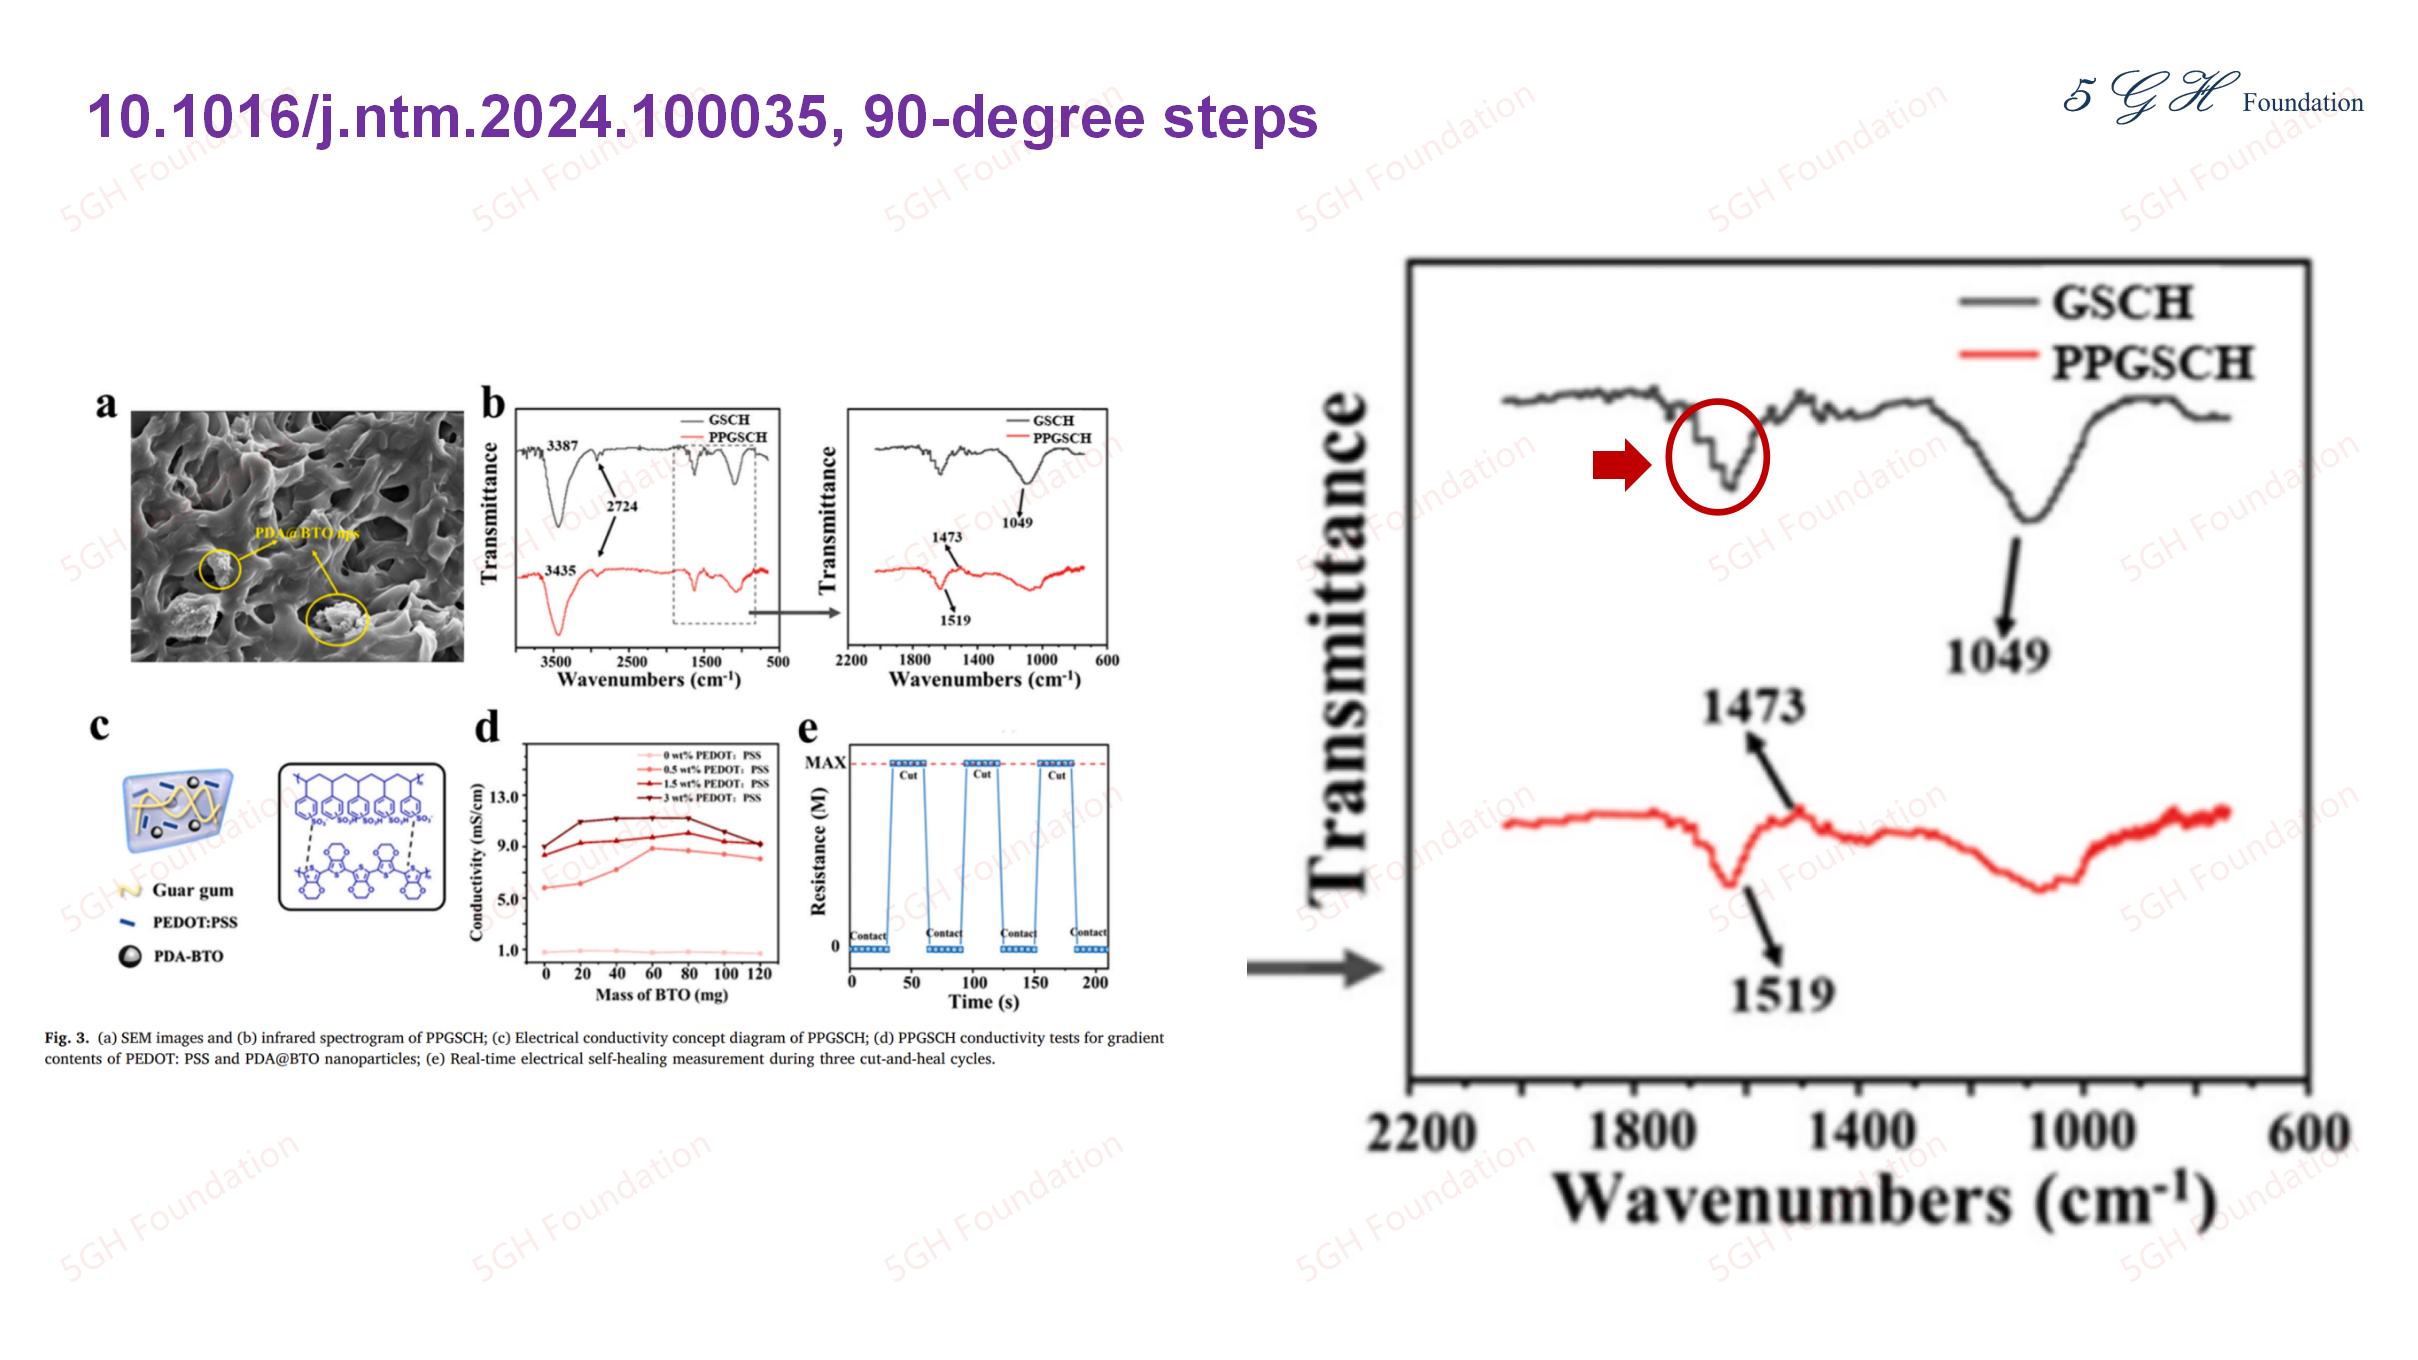
Abnormal 90-degree steps are observed in the infrared spectra, Figure 3(b) of this article. These 90-degree steps are unusual in infrared spectra.