
Journal Quality Report on "Journal of Alloys and Compounds"
Recently, the 5GH Team analyzed the all 49 articles published on Volume 1015 of the journal "Journal of Alloys and Compounds", an Elsevier title, and found 10 of them (about 20%) have questionable data, spectra, and/or images, including incorrect EDX peaks, improper application of the Tauc plot method, abnormal error bars, chaotic Cole-Cole curves, reused spectra, unusual (fabricated or overly processed) SEM images, and others. While not all of these cases were necessarily due to misconduct, the high percentage of the problematic articles suggests that this journal does not maintain a rigorous editorial and peer review process. Based on these results, the 5GH Team assigns the Journal Quality Index [1] for "Journal of Alloys and Compounds" to be E.
10.1016/j.jallcom.2025.178822
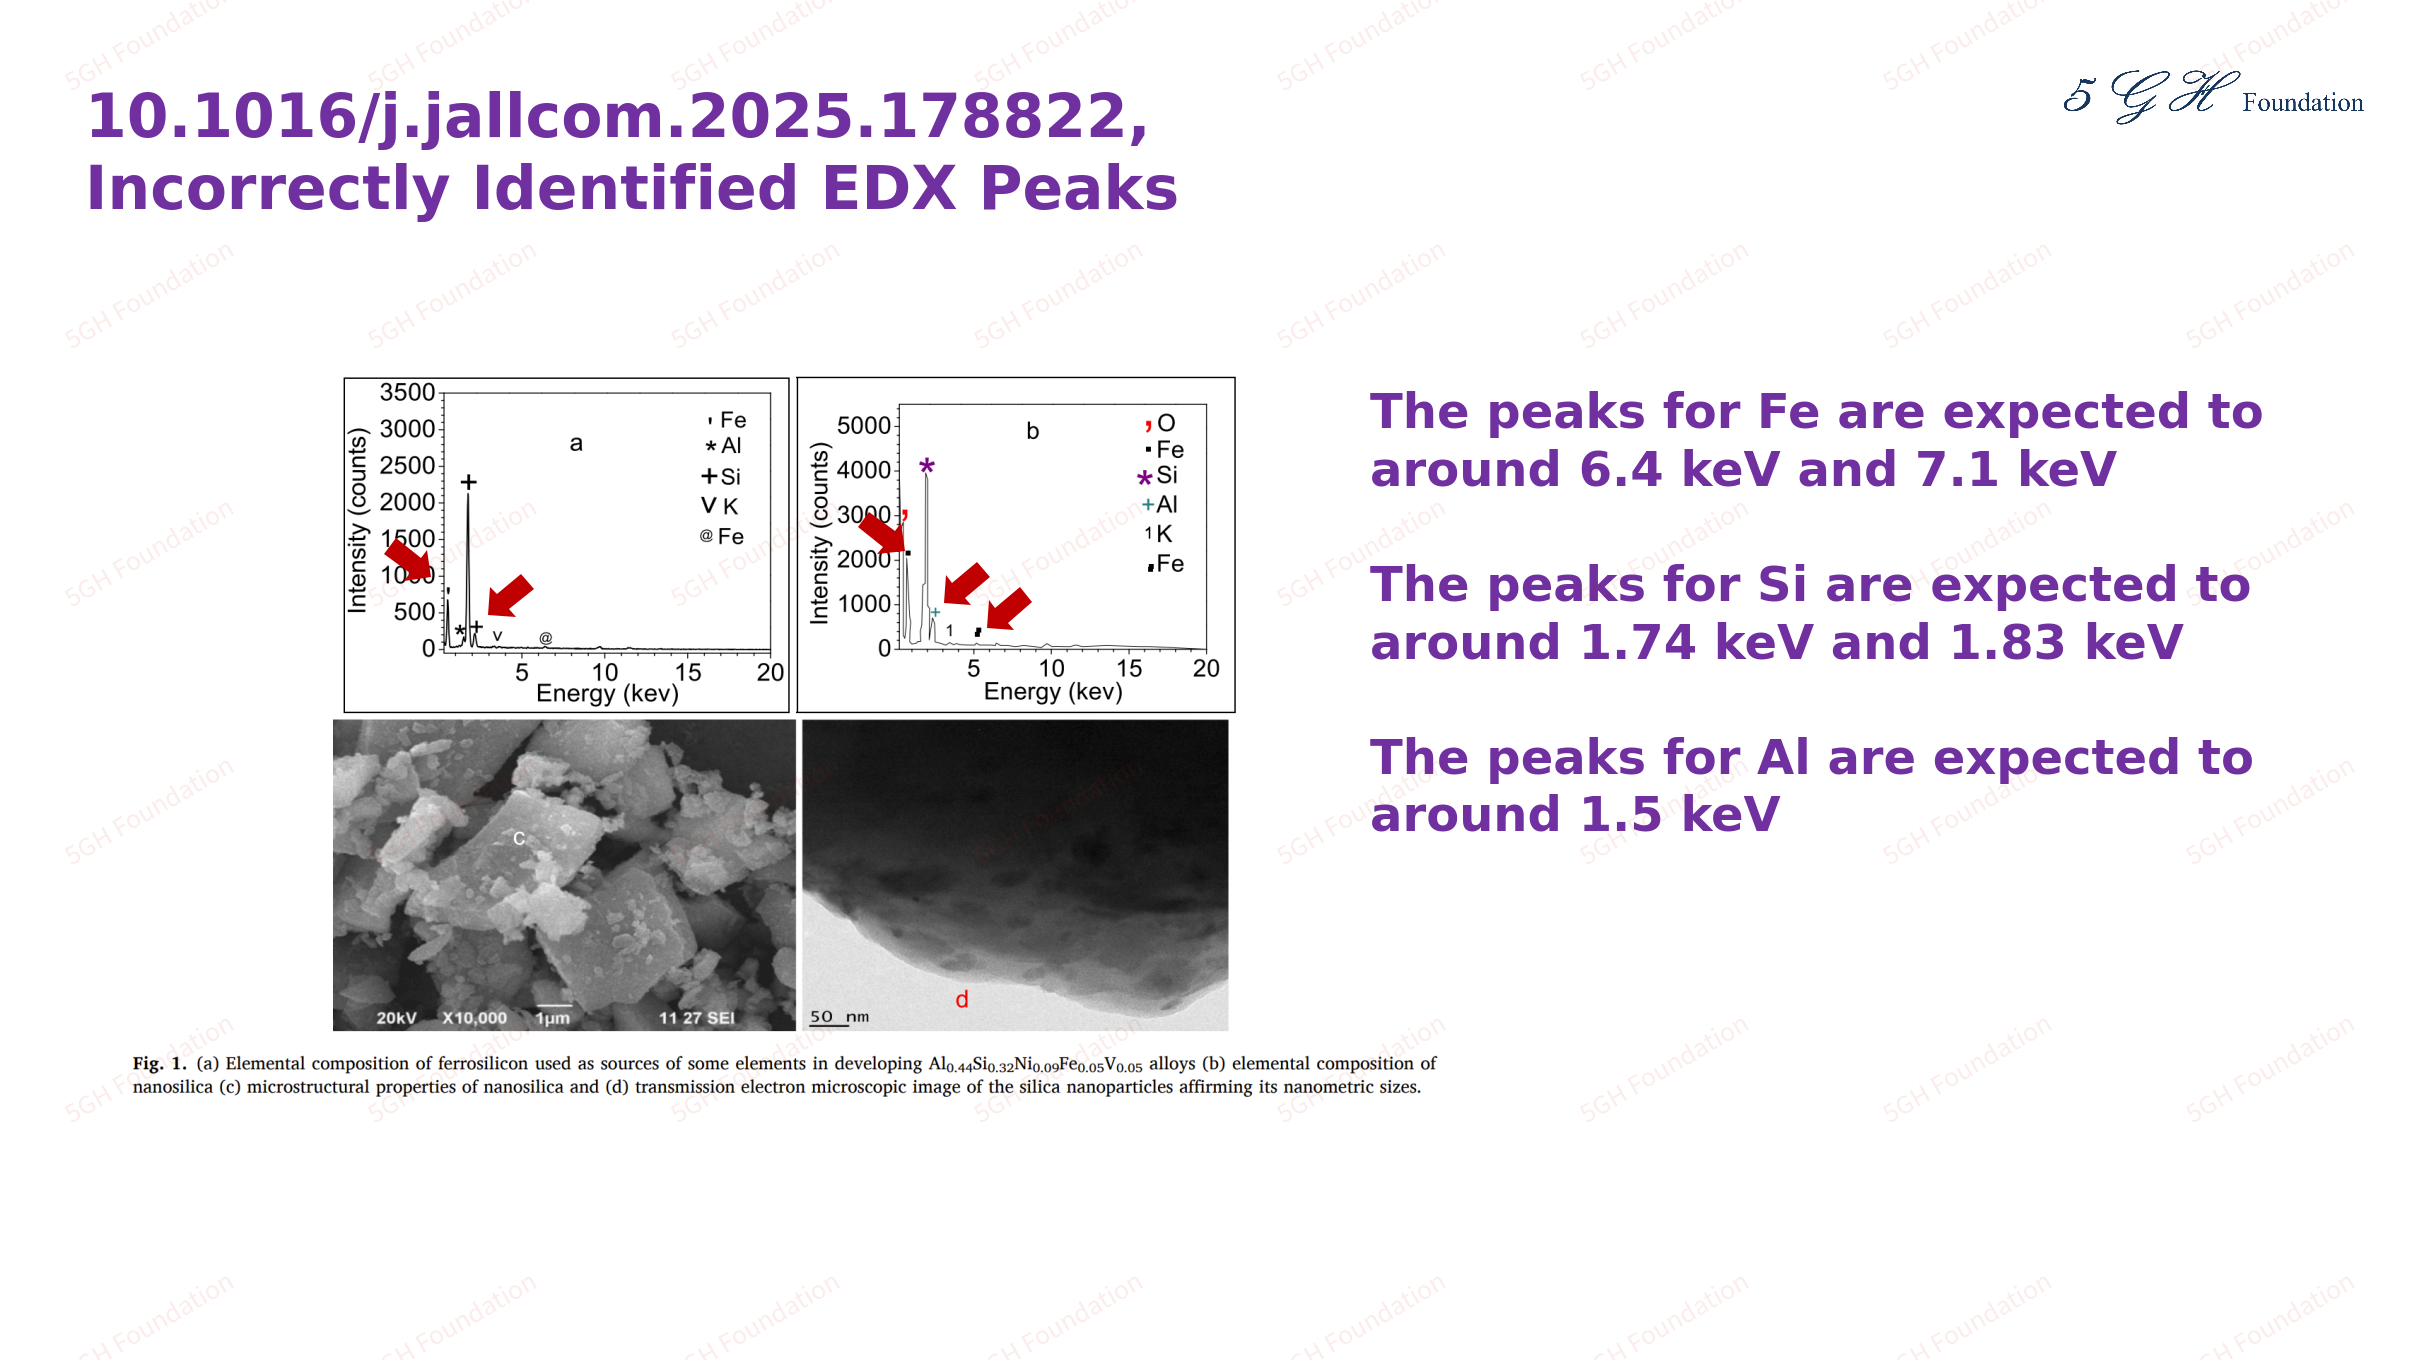

In Figures 1 and 8 of this article, several EDX peaks are incorrectly identified (as indicated by the red arrows). Additionally, there is evidence of manipulation around the Si peak in Figure 8.
10.1016/j.jallcom.2025.178826
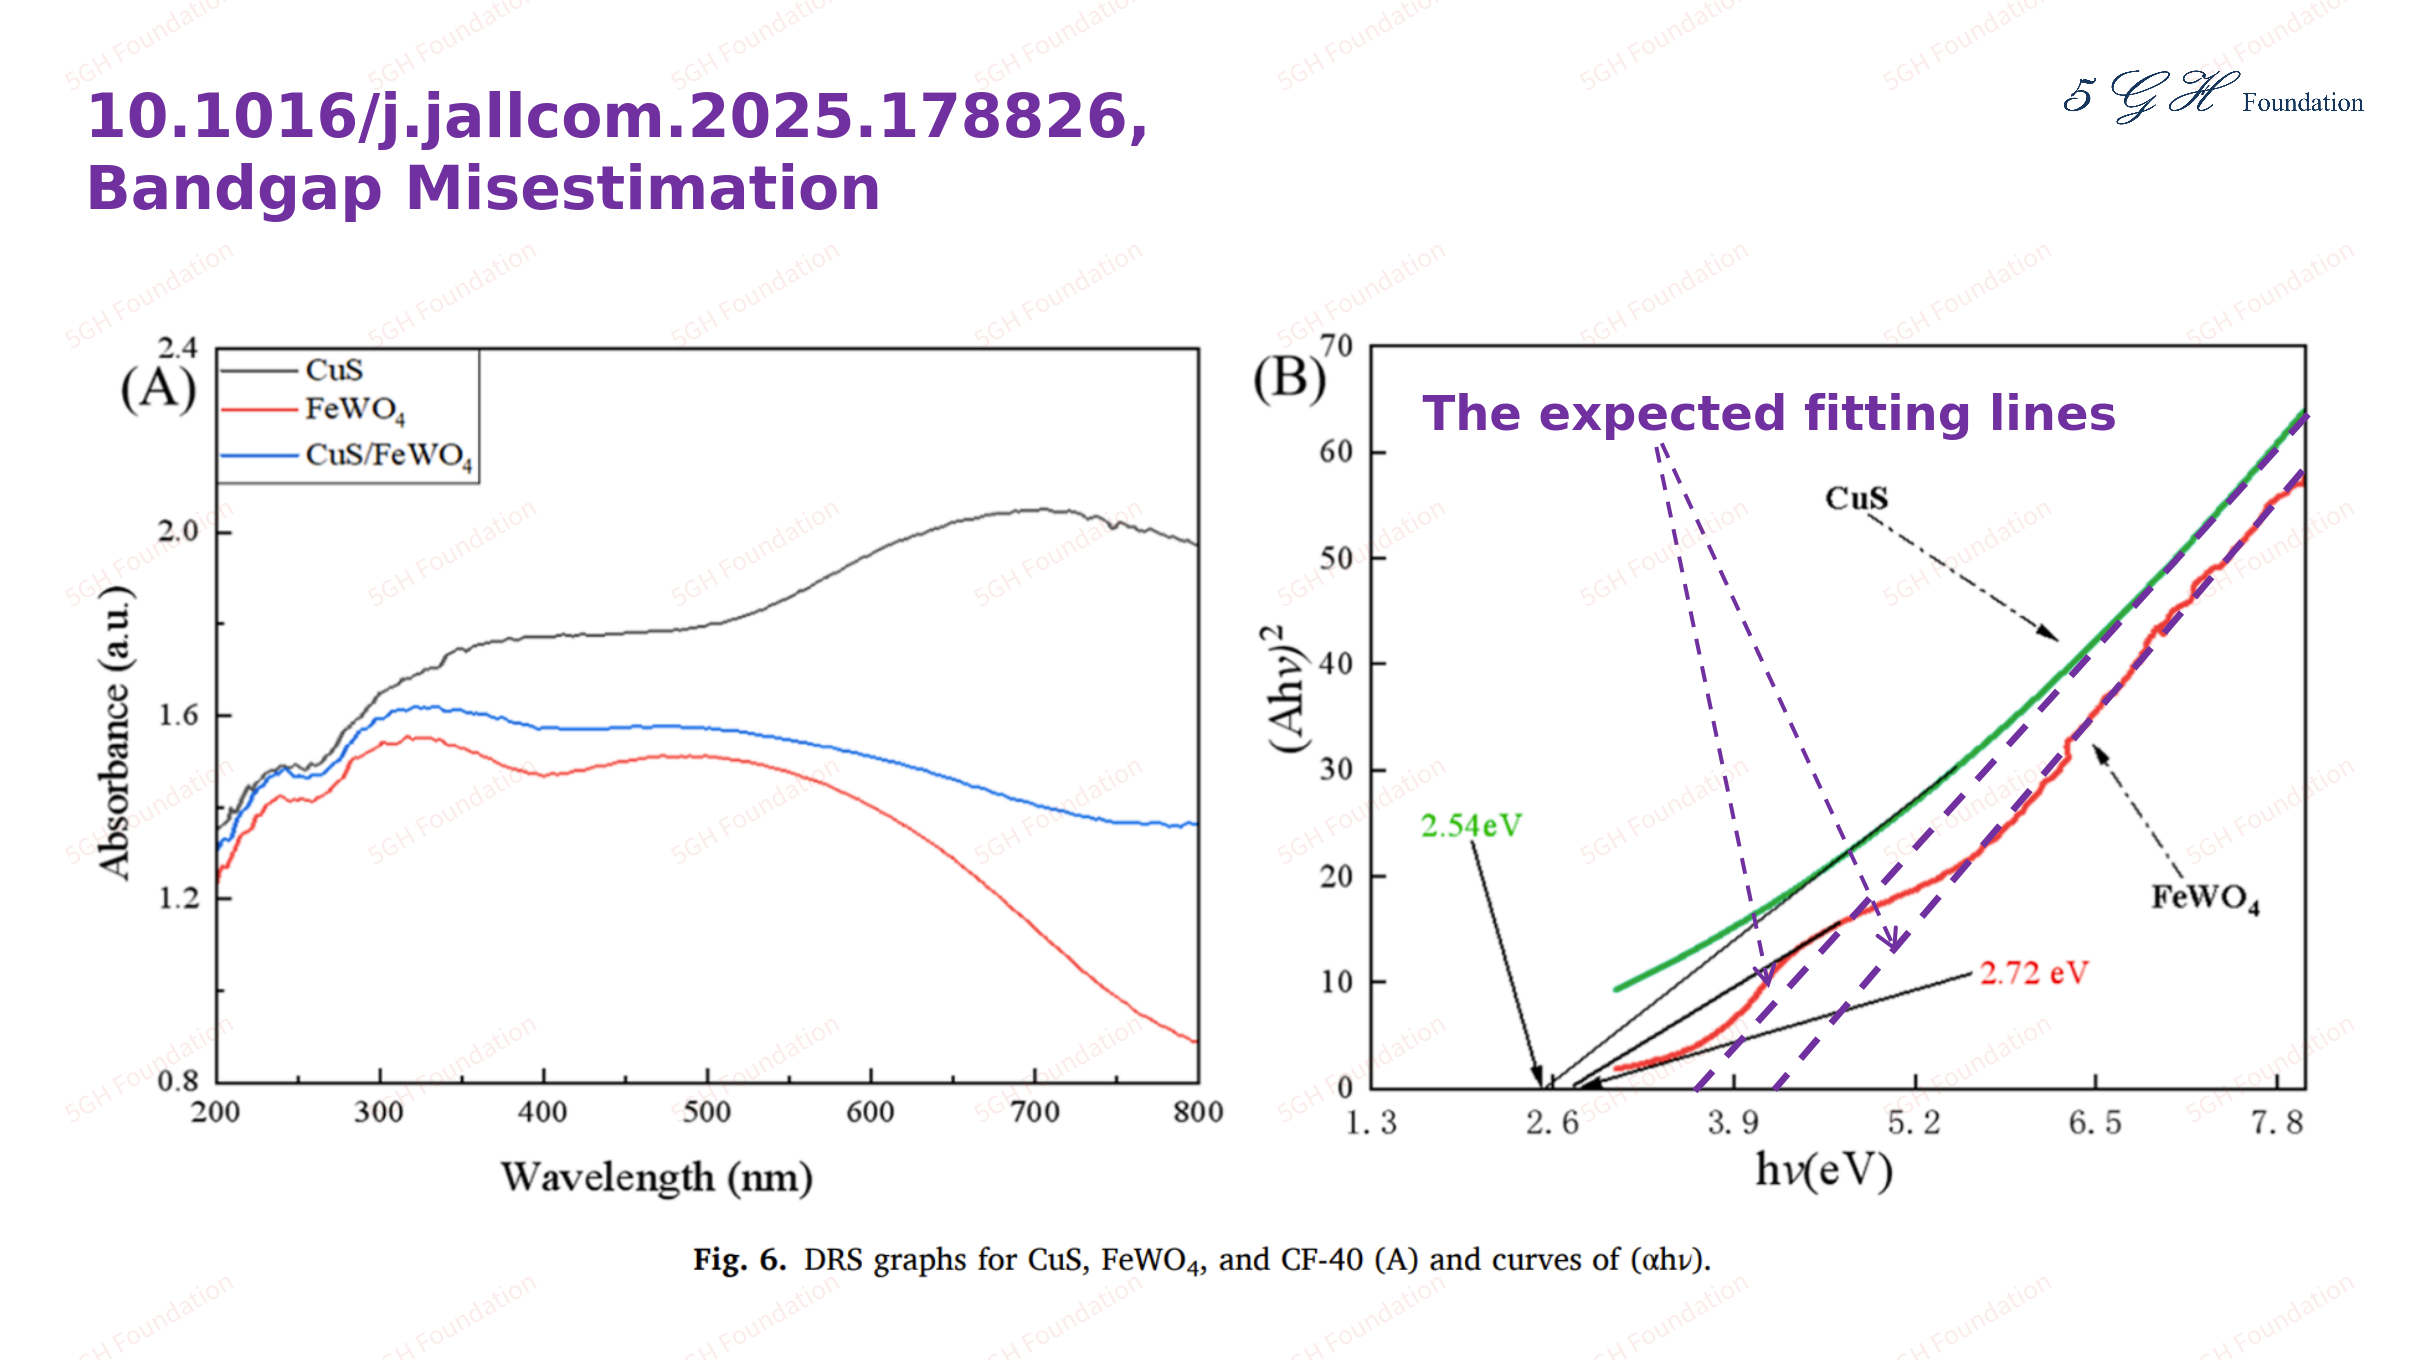
The bandgap estimation from Figure 6 of this article is incorrect. The correct Tauc plot method involves fitting the linear portion (typically the high hν region) of the (αhν)2 versus hν curves, as indicated by the purple dashed lines, rather than the back lines used by the authors. The results from the purple dashed lines is inconsistent to bandgap values for CuS and FeWO4 reported in other studies. This discrepancy is likely due to (1) the incorrect results from absorbance measurements shown in the Figure 6(a), and/or (2) the (αhν)2 versus hν curves in Figure 6(b) being incorrectly derived from Figure 6(a). Although the exact reasons are unknown, It seems that the author therefore applied the back line to obtain seemingly correct values. This methodology and the resulting values are misleading.
10.1016/j.jallcom.2025.178833

Unreasonable asymmetric error bars are observed on the Figure 8 of this article.
10.1016/j.jallcom.2025.178844

The bandgap estimation from Figure 3(b) of this article is incorrect. No linear region is observed on the (αhν)1/2 versus hν curves on Figre 3(b), suggesting neither that “the materials are not indirect bandgap semiconductors” or that “the absorbance measurements were not properly setted up”.
10.1016/j.jallcom.2025.178854
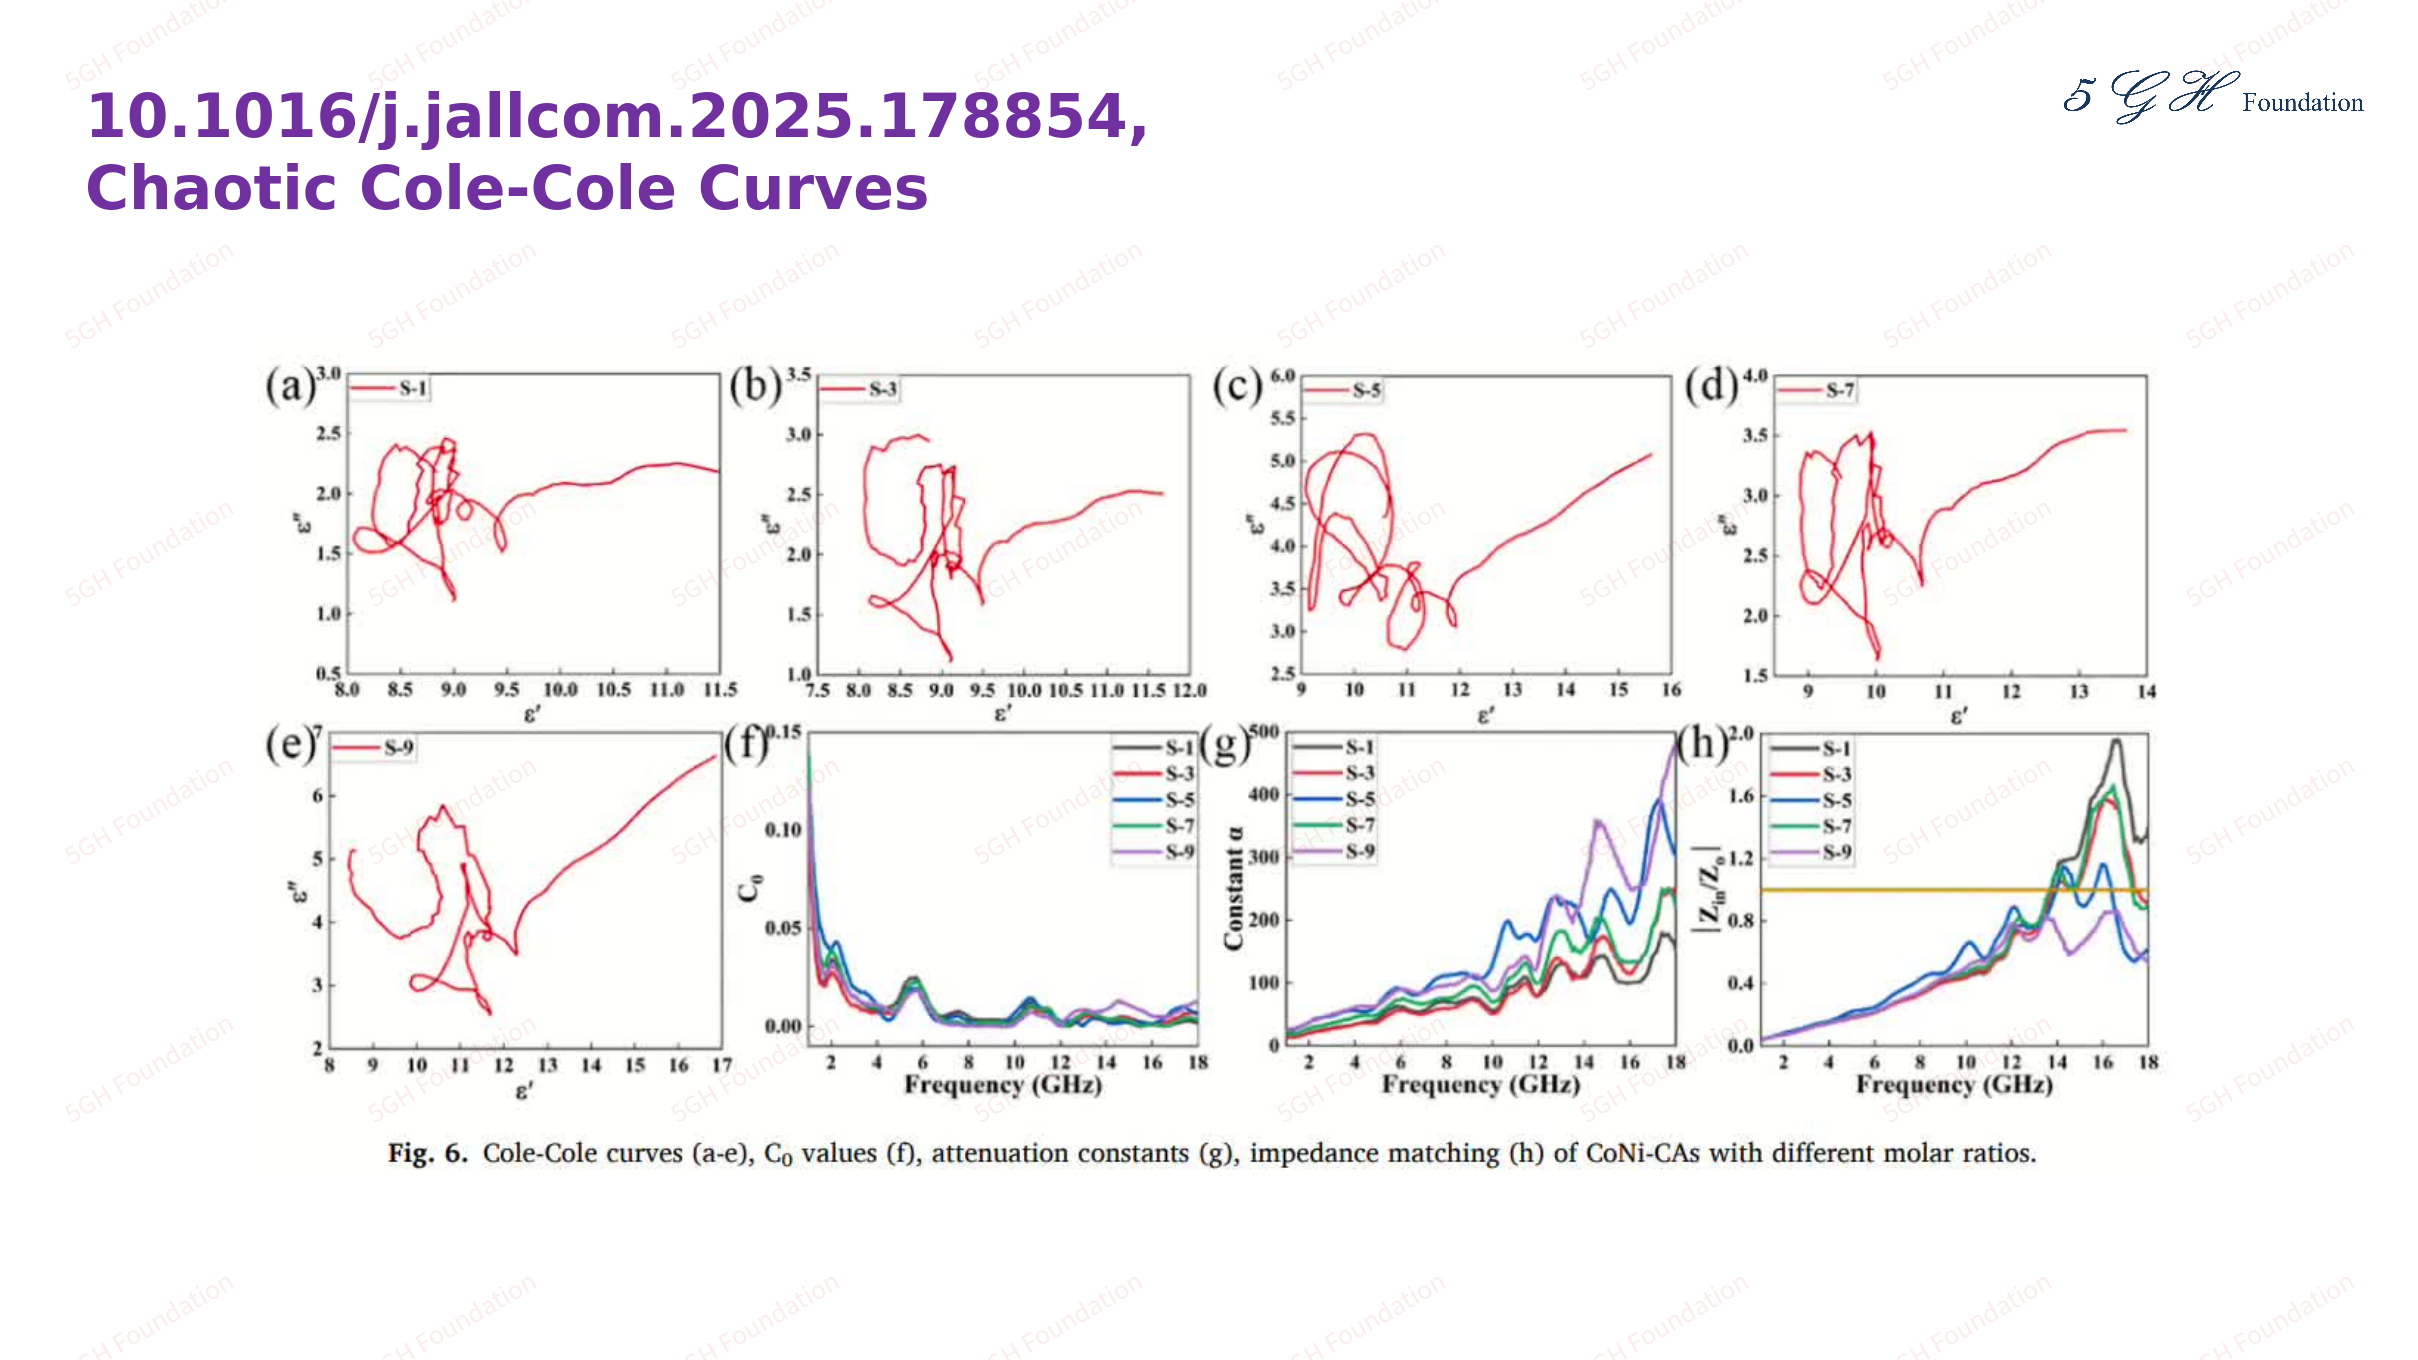
The chaotic Cole-Cole curves on the Figure 6 (a)-(e) suggest that the dielectric measurements were not properly setted up.
10.1016/j.jallcom.2025.178856

The Zn EDX peaks for two samples, TiZr-120s and SDS0.75g-TiZr, shown on Figure 2 are questionable. Although Zn are the dominant in both of the samples, strong Zn peak around 1 keV is observed from TiZr-120s, but it is not observed from SDS0.75g-TiZr, and moderate Zn peaks around 8.5 keV and 9.5 keV is observed from DS0.75g-TiZr, but they are not observed from TiZr-120s. These inconsistent Zn peaks between the two samples suggests that the data is questionable.

In Table 2 of this article, most but not all parameters (marked with red rectangles) are same for two samples. This is also abnormal.
10.1016/j.jallcom.2025.178885
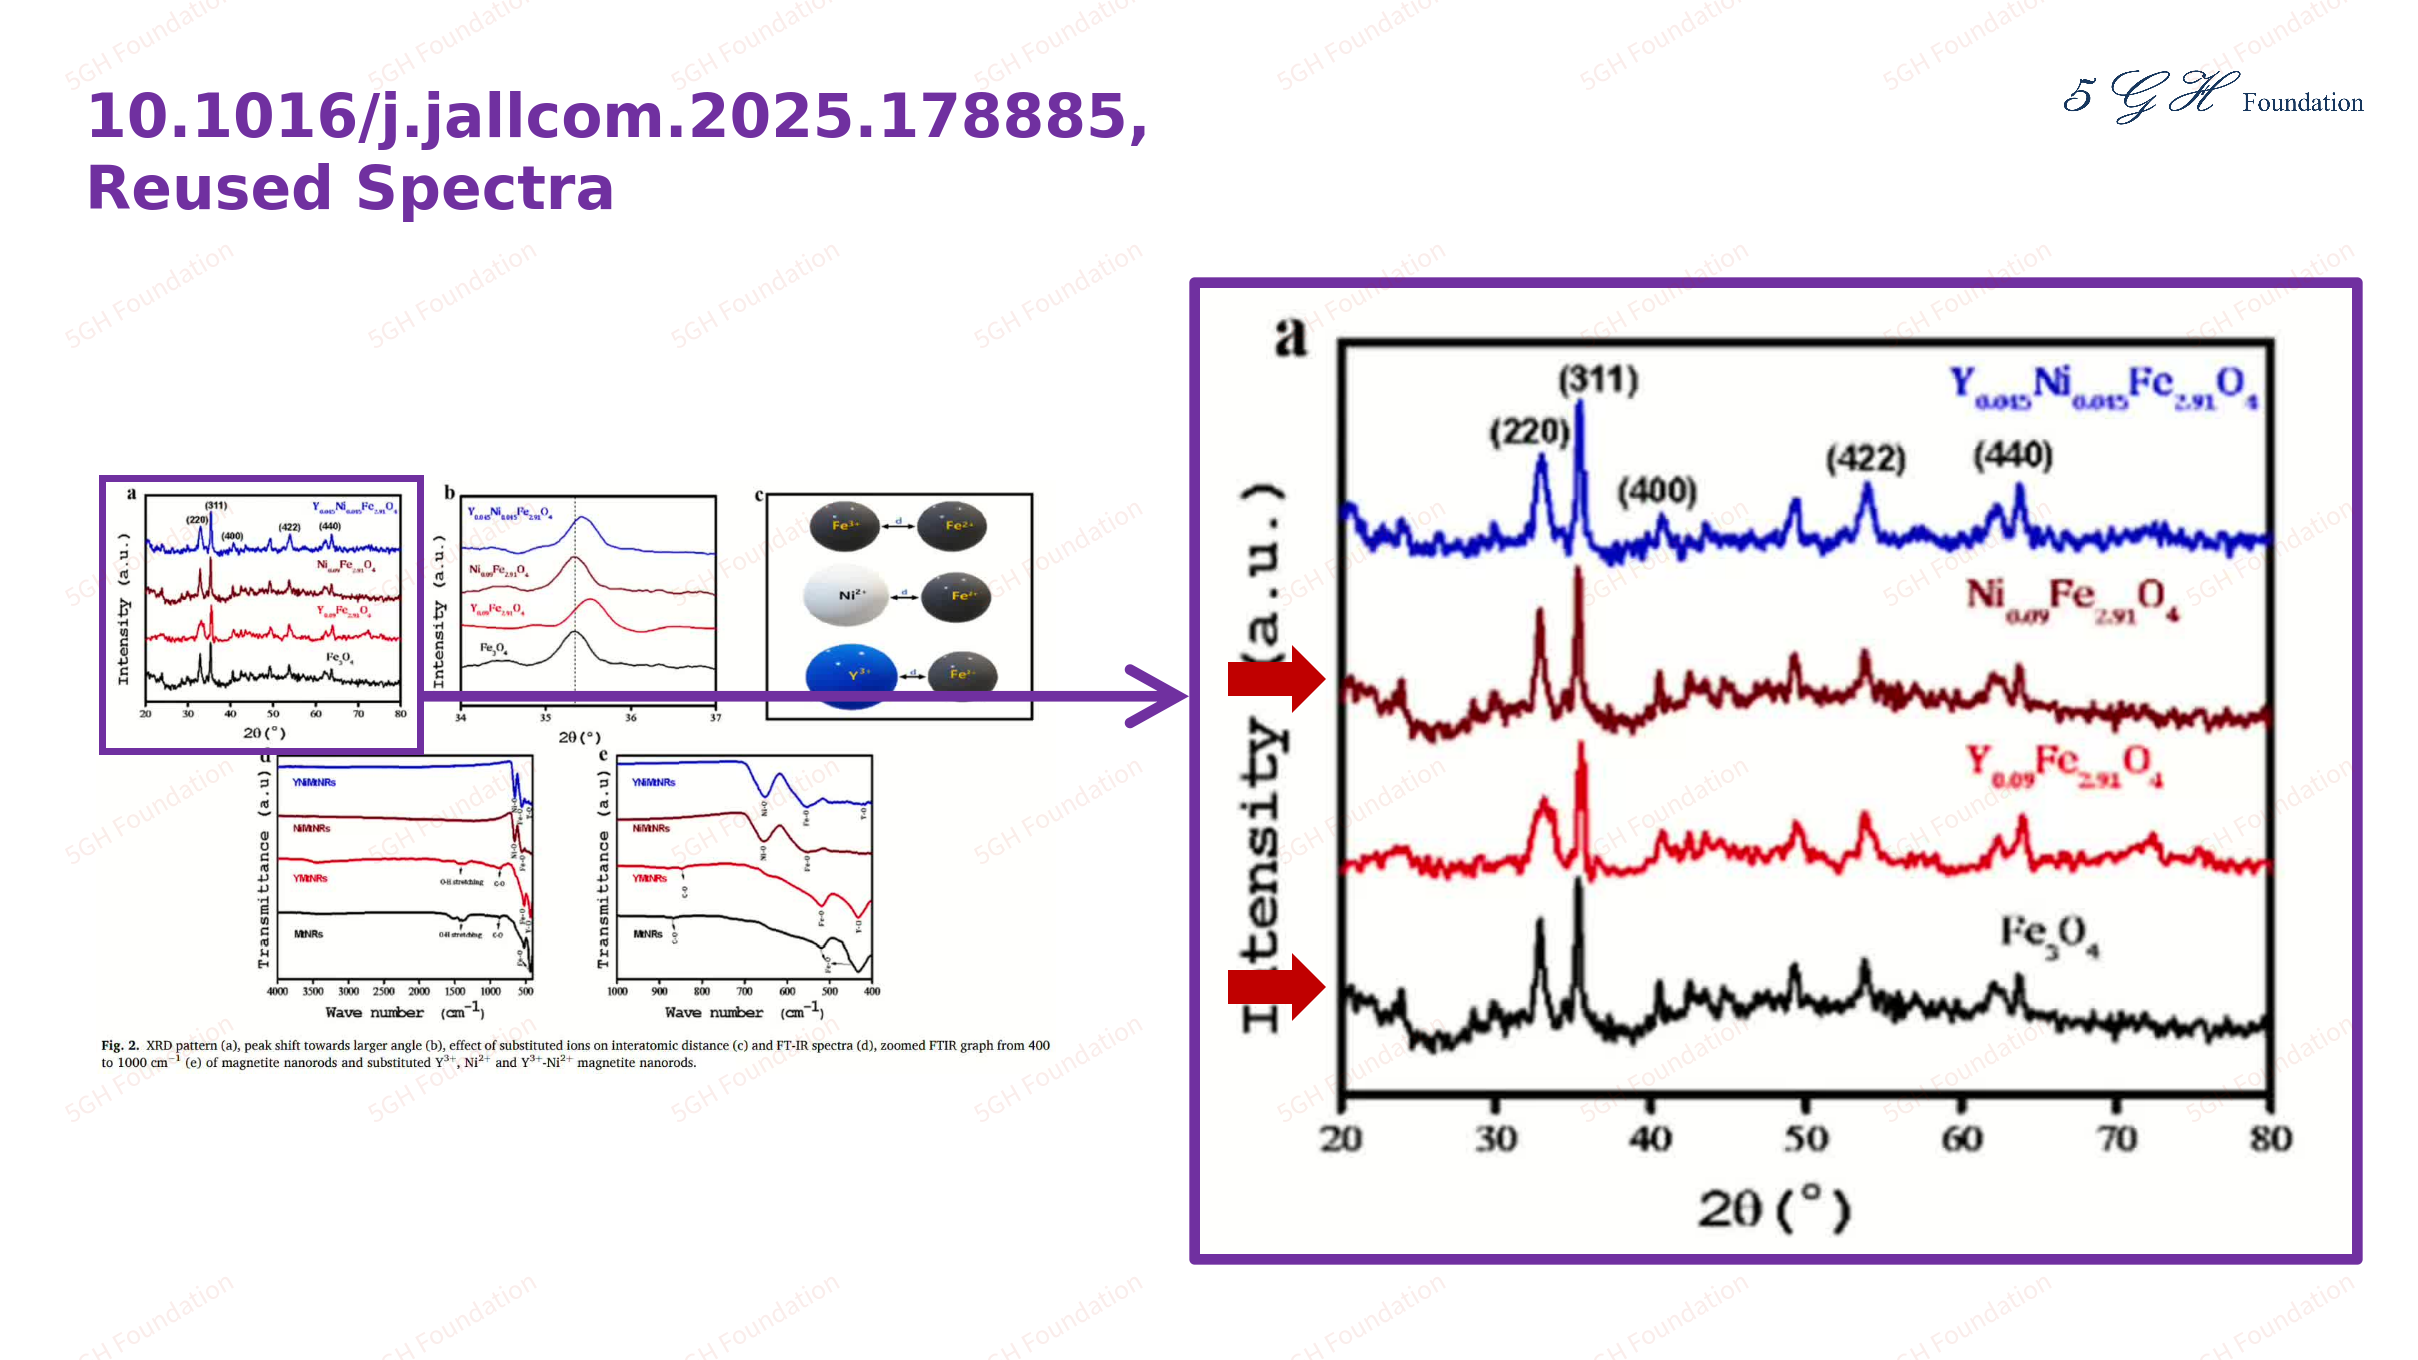
The black and brown lines on Figure 2(a) of this article are identical to each other.
10.1016/j.jallcom.2025.178895
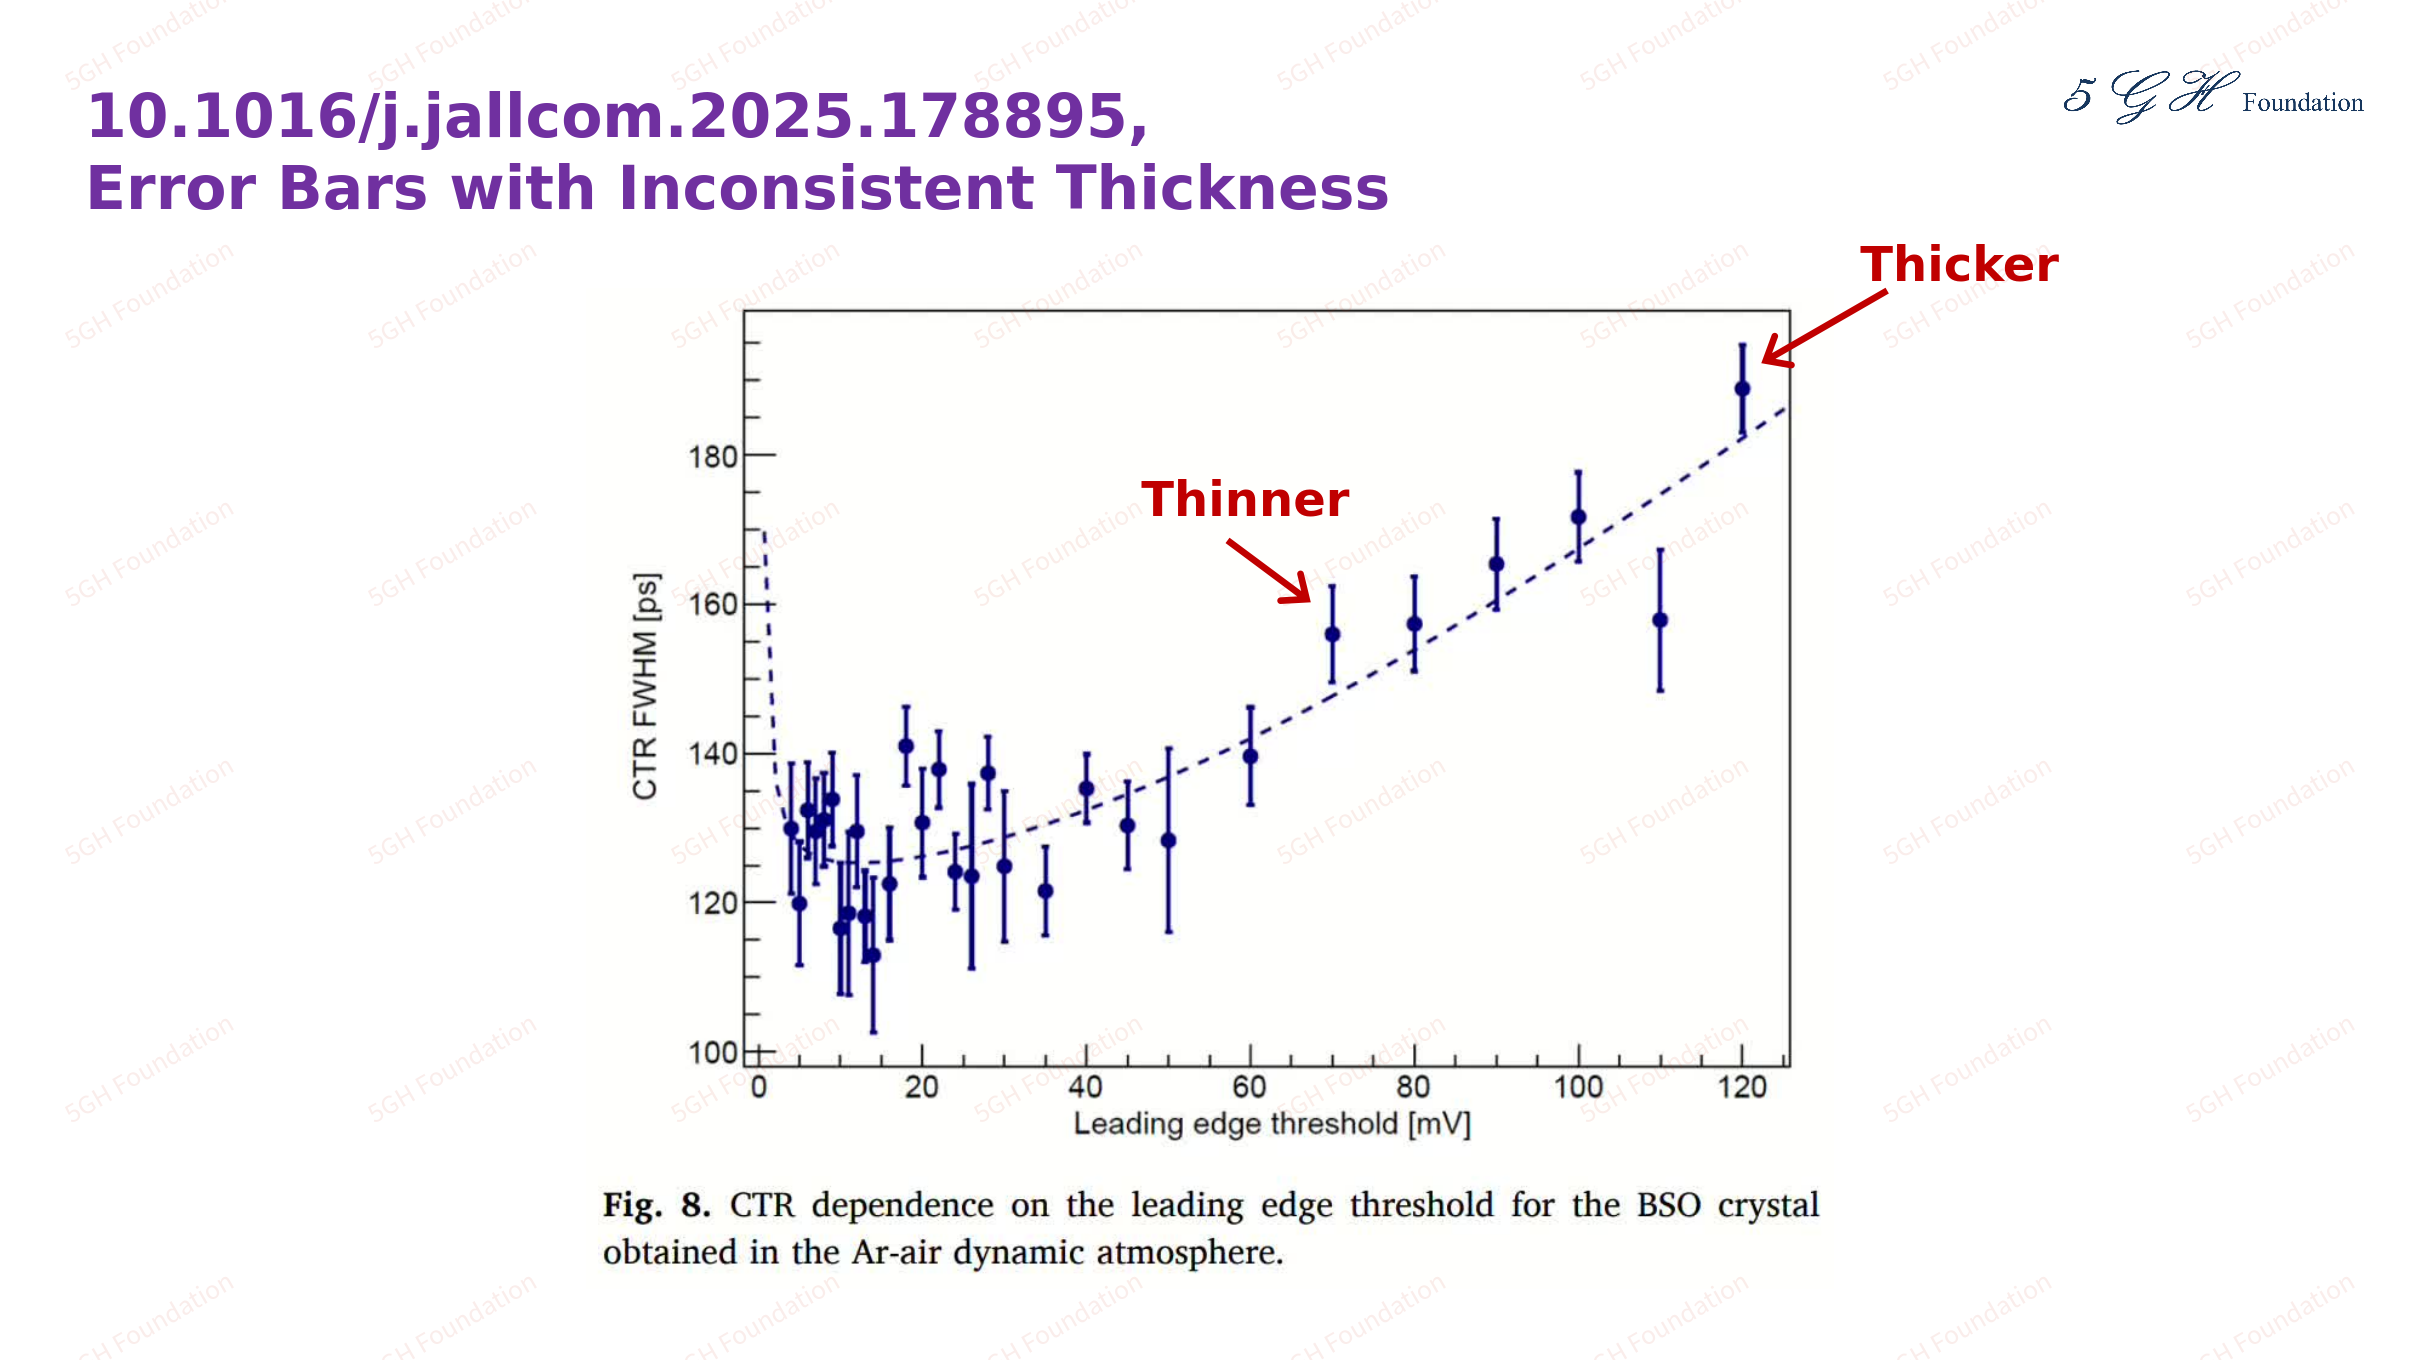
Thickness of the error bars on Figure 8 of this article is not inconsistent.
10.1016/j.jallcom.2025.178902

The SEM images in Figure 3 (a)-(d) of this article appear unusual. It seems that they may have been fabricated or overly processed during publication.
10.1016/j.jallcom.2025.178907

The SEM images in Figure 3 and Figure 4 of this article appear unusual. It seems that they may have been fabricated or overly processed during publication.
Reference