Unintentional Error Bars Abnormalities Caused by Plotting Software
Recently, concerns were raised regarding abnormal error bars in two articles by Jessie Payne [1-2]. However, in a reply to the 5GH Team Dr. Payne provide evidence that the abnormalities were caused by the Excel instead of intentional manipulations.
Dr. Payne stated in the e-mail that:
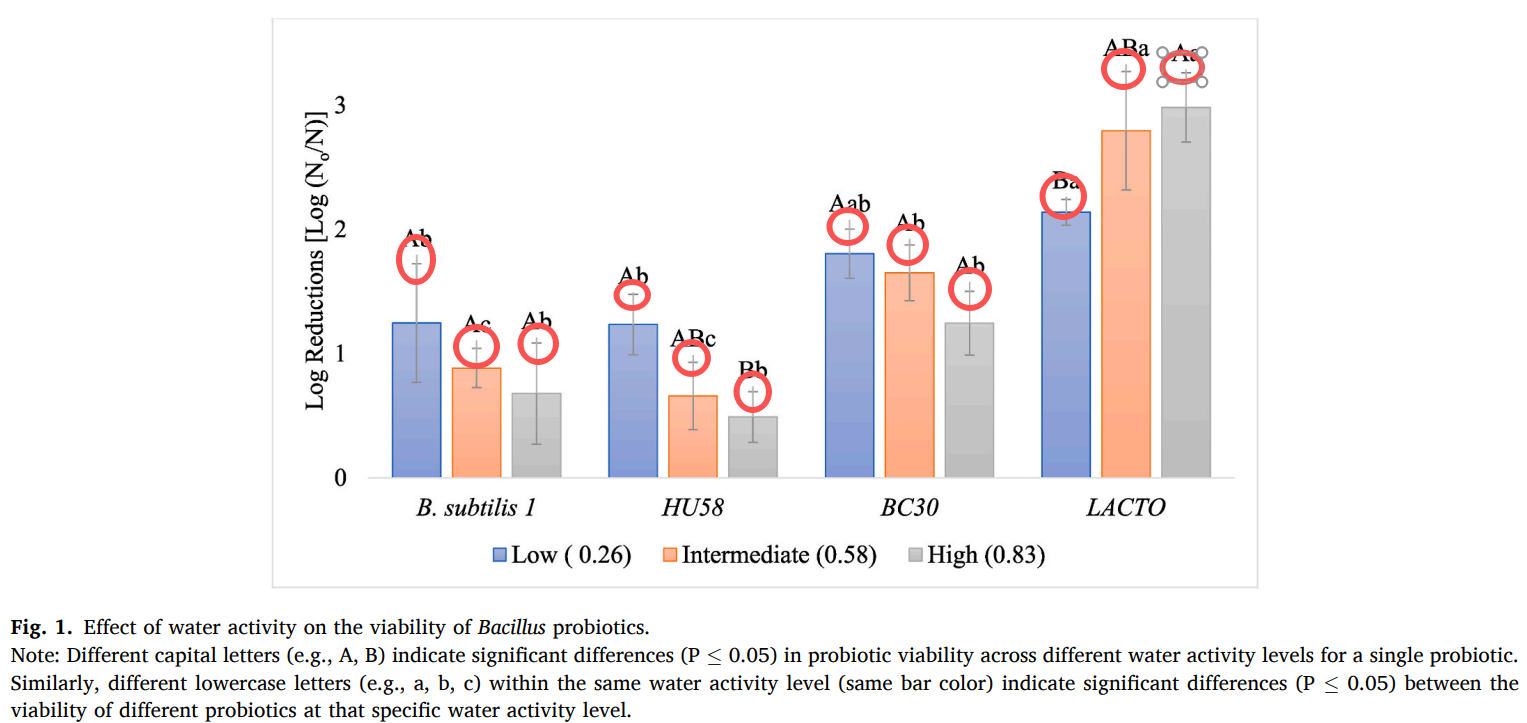
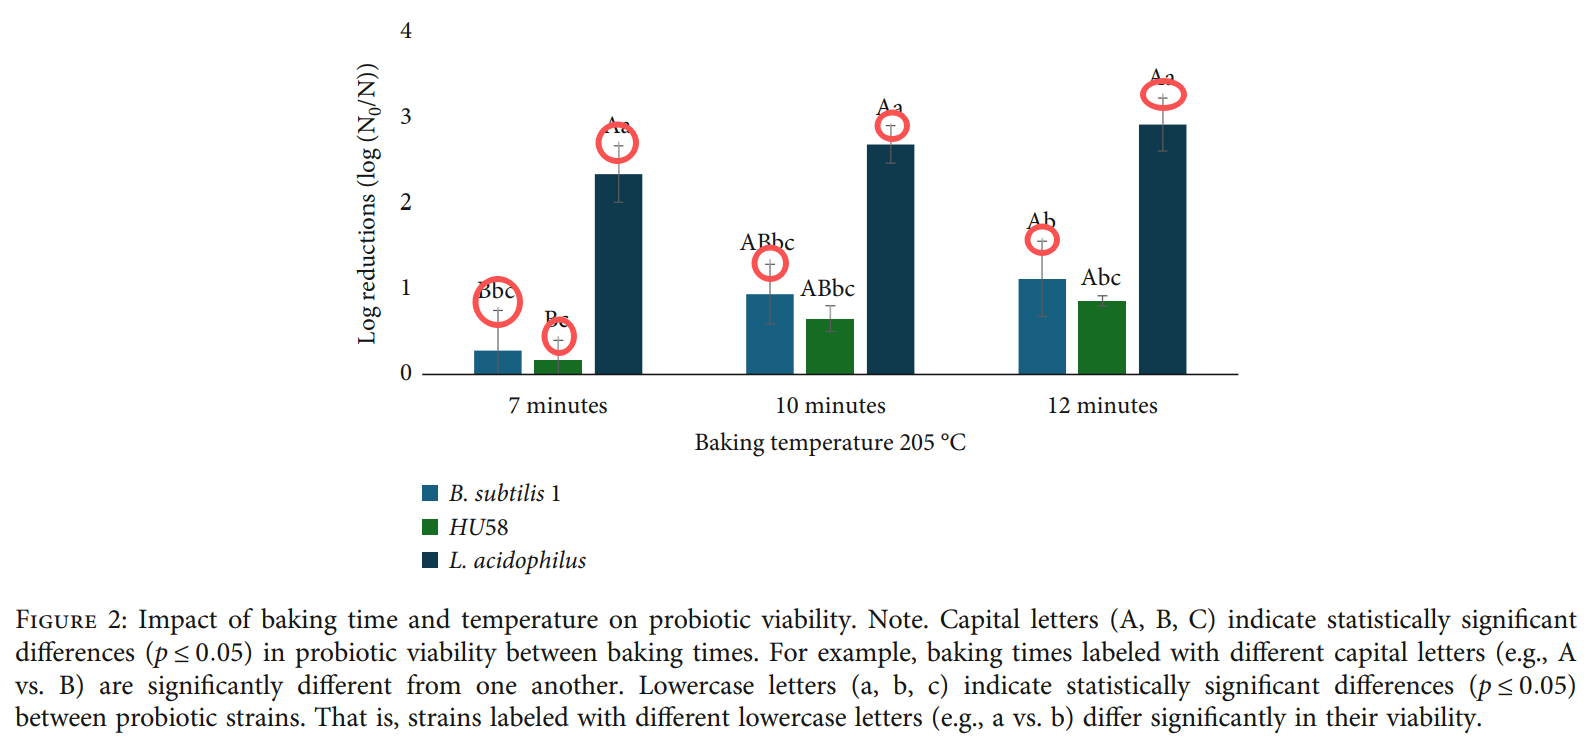
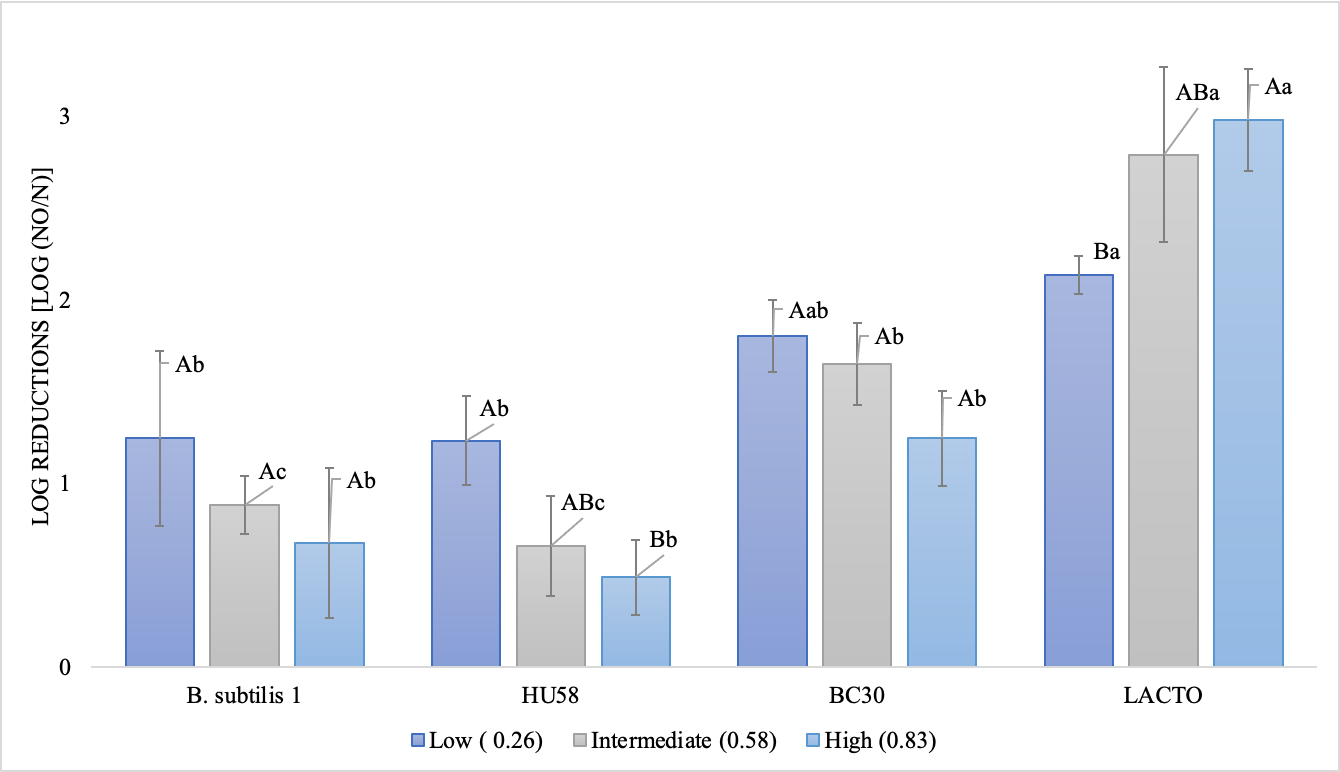
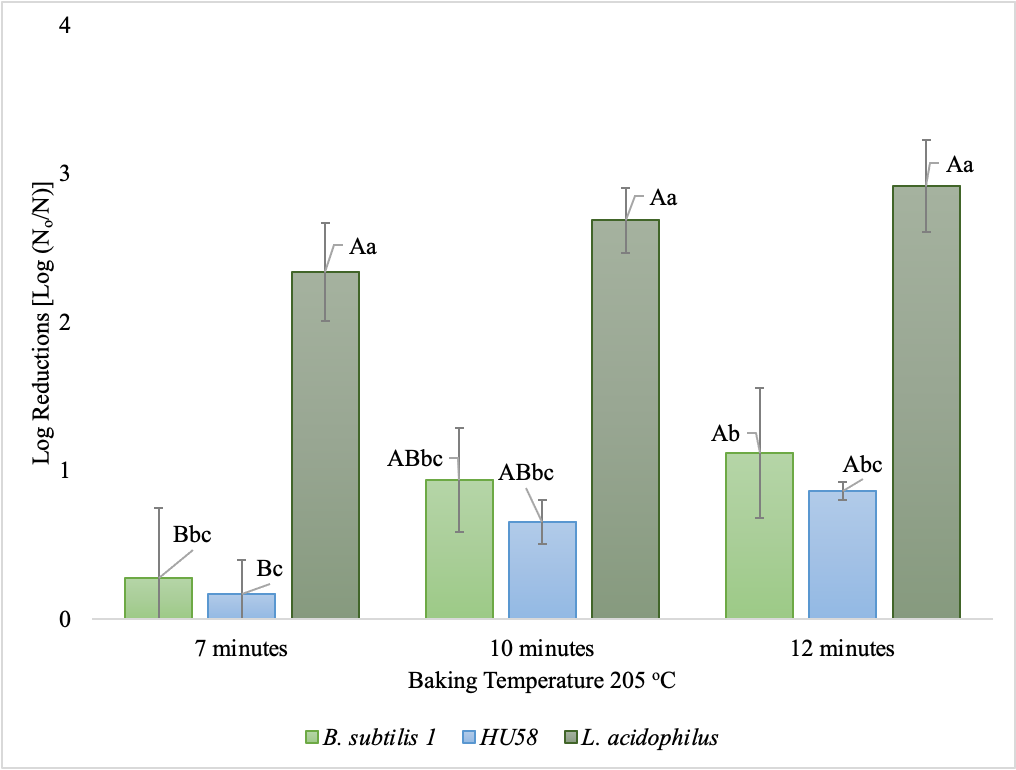
... When the value labels in Excel are manually adjusted for visibility, Excel automatically draws a connector line from the label to the corresponding bar. These connector lines can appear similar to extended error bars, which explains why the upper caps in the Figures appear irregular.
For your ease, I have revised the graphs to remove these connector lines. I have attached the updated images, which accurately reflect the correct error bars as originally generated in Excel ...
The 5GH Team appreciates the clarification by Dr. Payne. Researchers in the scientific community should pay attention to this matter, to avoid similar abnormalities in their future manuscripts.
Reference